
Modelling the effect of varying delegation rates on Community's FTSO and DIP rewards for the first 18 months on Flare

In this post I reveal the impact of varying Community delegation rates on the overall FTSO rewards and DIP rewards received by the Community. As Flare distributes the native FLR token on Jan 9th 2023, token holders will be able to wrap their tokens into wFLR and delegate to the FTSO, thus earning rewards claimable at the end of every epoch (3.5 days). Additionally, Flare’s system will take 3 random snapshots per monthly period of all Flare accounts to determine the wFLR balance of each account. An average across the snapshots is then calculated to determine the relative proportion that any account with wFLR will receive from the 676,040,637 FLR distributed per month (DIP).
The amount of FTSO and DIP rewards flowing to “Community” largely depends on the participation rate of the Community. For those FLR holders who do not participate in the system, or have their tokens on an exchange, they surrender their rewards to those who delegate and earn. To recap who is eligible to delegate and who is able to earn from the DIP distributions, read my report on Flare’s tokenomics.
As outlined in the report, “Community” supply refers to all FLR held by airdrop recipients + exchange supply/purchases + non-Flare related infrastructure providers (FTSO data providers, validators, attestation providers) + any FTSO, DIP and CCI rewards obtained by these players. In other words, “Community” supply refers to all FLR supply circulating except for those held by Flare-related entities (Foundation, FNL, VC fund, the team and advisors, and Flare backers).
In this study, I modelled the expected FTSO and DIP rewards in the first 18 months based on three Community delegation schemes:
Model A “moderate-high engagement” - 50% participation rate (wFLR/FLR) for months 1 to 6, 70% for months 7 to 12 and 80% for months 13 to 18.
Model B “incremental engagement” - 30% participation rate in month 1, 40% in month 2, 50% for months 3 to 5, 60% for months 6 to 9, 70% for months 10 to 12, 80% for months 13 to 18.
Model C “low engagement” - 30% participation rate for months 1 to 6, 50% for months 7 to 12, 60% for months 13 to 18.
Tabulated results for each model is shown below.
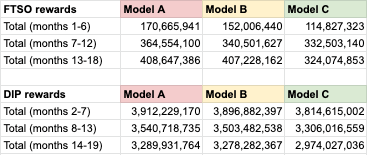
Clearly, the total FTSO and DIP reward flows to Community is proportional to their participation rate. Comparing the Community FTSO rewards between Model A and Model C show that in the first 6 months of delegating, an additional 55,838,618 FLR is rewarded to Community if participation rate is increased from 30% (C) to 50% (A). Of course, such additional FLR is distributed amongst a larger cohort of Community delegators (more on this later). This represents a 48.63% increase with respect to Model C’s rewards. When comparing the FTSO rewards between the same delegation schemes for months 13 to 18, we see that Model A receives 76,144,246 more FLR than Model C. This equates to an additional 22.90%. The smaller percentage increase in rewards is reflective of the lower relative increase in participation rates from 60% (C) to 80% (A).
Looking at the DIP rewards from Model A vs Model C, we see that an additional 97,614,168 FLR is rewarded to Community when participation rate increases from 30% to 50%. This equates to a 2.56% increase. This percentage increase is much more subtle for DIP rewards (as compared to the FTSO rewards differential) because for the first 6 months, there is less FLR from non-Community ecosystem players eligible to draw DIP rewards from Community’s lack of participation. This dynamic changes with the subsequent release of Backers G1 and G2 FLR supply, after months 6 and 13 respectively. To demonstrate this, we look at months 14 to 19, where a 80% Community participation rate from Model A yields 315,904,728 more FLR than in Model C, which represents a 10.62% increase.
So far, this report has revealed some key insights into the rewards that Community could expect, given various participation rates. An increase in participation rate yields a higher total FTSO and DIP rewards to Community, which would have otherwise flowed to other ecosystem players who are also eligible to delegate and/or earn. As demonstrated above, the changes in FLR rewards flow to Community (and thus other ecosystem entities) depends on which time period the participation rates vary. In the next section of this report, we will analyse the individual FLR rewards that each Community participant is expected to receive from FTSO and DIP, under the three participation models.
First, assume a user input of 10,000 FLR is wrapped and delegated beginning at TDE. Modelling the three specified delegation schemes as above, we get the following results for an individual user with a start balance of 10,000 FLR: